Making Data Display Less Boring in webforJ

Data is the lifeblood of business applications, and displaying it properly can make or break someone's experience using your app. In order to visualize data, most developers quickly turn to tables for displaying that data. Here's the problem: just throwing information into rows and columns doesn't always tell the story clearly enough.
When users glance at a table, the idea is that they immediately understand what matters. Is that price change good or bad? Which items need attention? What's trending up versus down? If your users have to pause and think, squint at numbers, or do mental math to understand their data, your interface isn't working hard enough for them. Perhaps your first instinct is to say that tables aren't the answer, but that isn't the case.
This is where renderers come in. In webforJ, cell renderers let you transform raw data into visual, instantly understandable information. Earlier this year, I built a mock cryptocurrency dashboard, which is a perfect example of an app that needs quick, understandable information at a glance, since crypto data is fast-moving, emotionally charged, and needs to be digested within seconds. Green numbers for gains, red for losses, formatted prices, inline charts—all rendered dynamically to tell the story your data is trying to communicate.
The fun part was using renderers to contain all of this information inside a tidy table, and in this post, we'll explore when and how to use these renderers to build tables that don't just display data, but actually communicate with your users.
What Are Renderers?
Using renderers, instead of plain text, you can inject custom HTML, apply conditional logic, and style content dynamically, all on the client-side.
webforJ uses lodash templates to power renderers. Think of them like template literals in JavaScript, but with access to your table's data. You write a template that mixes HTML with JavaScript, and webforJ handles the rest.
The syntax is simple:
<%= cell.value %>outputs data<% if (value > 100) { %> ... <% } %>adds logic<%- userInput %>safely escapes HTML
Inside your template, you can access the current cell, row, and column objects, giving you everything you need to display information in a way that makes sense. Want to show different HTML based on the row's data? Check another column's value? Format based on position? It's all available.
When to Use Renderers?
Great, you can make your data look nice, and we touched on why you might want to use renderers as a tool but when is this appropriate; what's a good use case?
When you display "1234.56" in a table cell, your user sees a number. Depending on the label for that column, they will know a value, but not necessarily what that value means. But, when you display that same number in green with a + sign and format it as "+$1,234.56 (+5.23%)", you've told a story: this is good news, money went up, and here's by how much.
Renderers let you add visual context - color-coding values, adding status badges, embedding icons or images, etc. They handle dynamic formatting so one renderer can manage all your edge cases for decimal places, currency symbols, or date formats. They make data interactive by turning text into clickable links or embedding action buttons. And because they run client-side, your server sends raw data while the browser handles presentation, keeping everything fast.
The real power? You can apply complex logic and generate rich HTML—all from a single, reusable renderer class. They are to be used when you want your user to know something or get an impression that's more than just the simple data being displayed within a cell.
The Scenario: A Cryptocurrency Dashboard
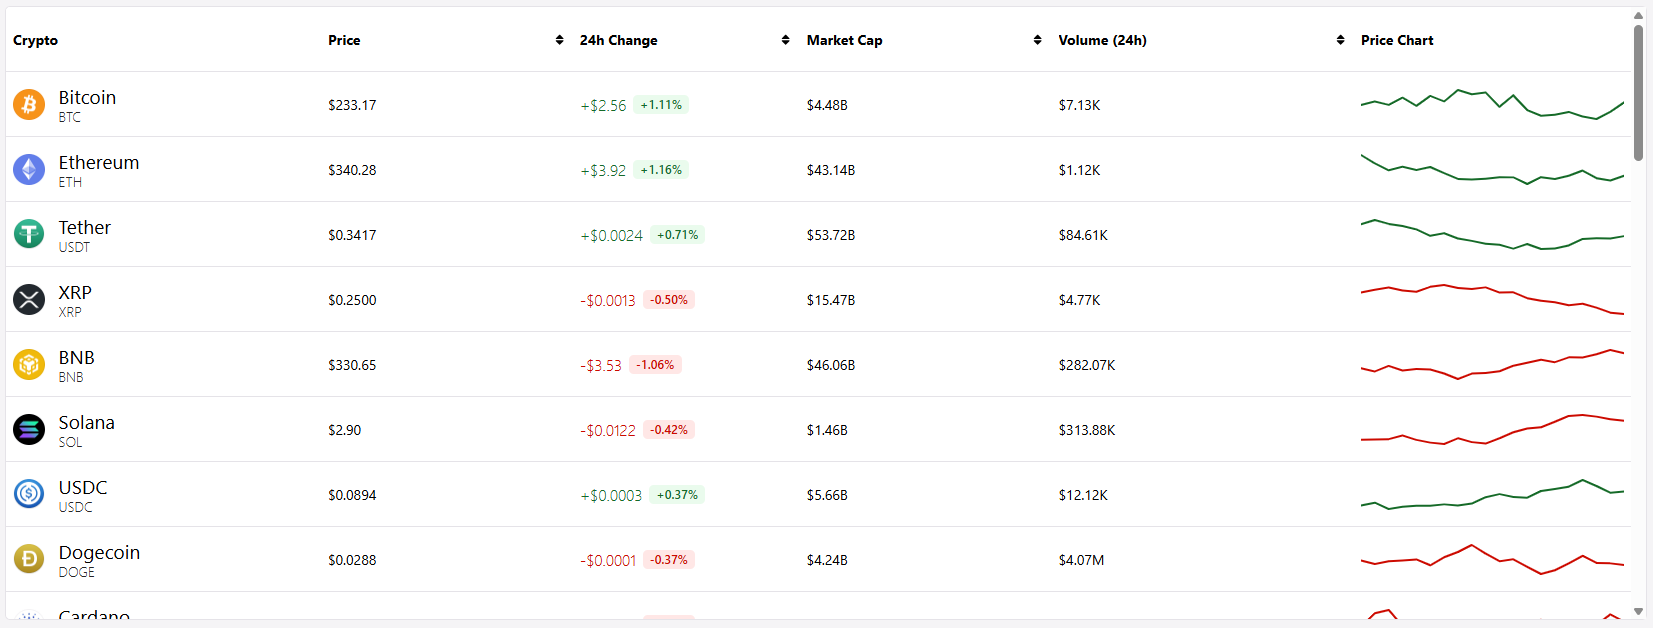
As mentioned, I built a cryptocurrency dashboard that displays real-time market data. It's the perfect use case for renderers because crypto traders need to process information fast - a few seconds of hesitation can mean missing an opportunity.
The table shows the usual suspects, but uses renderers in a few places: coin names, current prices, market cap, and 24-hour trading volume. One of the most important columns is the one showing price changes. That's where users' eyes go first, and it needs to communicate instantly: Am I making money or losing money? How much?
Raw numbers really just don't cut it here. -1234.56 and 2345.67 look similar at a glance, but they mean very different things. One should trigger concern, the other excitement. To help signal this excitement, you can use color to paint a picture. And the formatting matters too - large changes need different decimal precision than small ones, and both the dollar amount and percentage change should be visible.
This is where the PriceChangeRenderer comes in. It takes those raw numbers and transforms them into color-coded, properly formatted indicators that tell the story at a glance.
Building a Custom Renderer
Let's build the PriceChangeRenderer step by step. The full code is surprisingly concise, but it does a lot of work. Here's what it looks like:
public class PriceChangeRenderer extends Renderer<Cryptocurrency> {
  @Override
  public String build() {
    return /* html */"""
          <%
            const priceChange = parseFloat(cell.row.getValue('PriceChange24h'));
            const percentageChange = parseFloat(cell.row.getValue('PriceChangePercentage24h'));

            // ==Format price change==
            const sign = priceChange >= 0 ? "+" : "-";
            let formattedPrice;
            if (Math.abs(priceChange) >= 1) {
              formattedPrice = sign + "$" + Math.abs(priceChange).toFixed(2);
            } else {
              formattedPrice = sign + "$" + Math.abs(priceChange).toFixed(4);
            }

            // ==Format percentage==
            const formattedPercentage = sign + Math.abs(percentageChange).toFixed(2) + "%";

            // ==Determine color class==
            let colorClass = "neutral";
            if (priceChange > 0) {
              colorClass = "gain";
            } else if (priceChange < 0) {
              colorClass = "loss";
            }
          %>
          <div part="price-change-container">
            <span part="price-change-<%= colorClass %>"><%= formattedPrice %></span>
            <span part="percentage-badge-<%= colorClass %>"><%= formattedPercentage %></span>
          </div>
          """;
  }
}
Let's break down what's happening here.
The Class Structure: Every custom renderer extends Renderer<T> where T is your data type. In this case, Cryptocurrency. You override one method: build(), which returns a string containing your lodash template.
Accessing the Data: Inside the template, we grab two values from the current row: the 24-hour price change and the percentage change.
Formatting Logic: Here's where the magic happens. We determine the sign (+ or -), then format the price with the right number of decimal places. Small changes get four decimals, large changes get two—this keeps the display clean and readable. We do the same for the percentage.
Conditional Styling: We check if the price went up, down, or stayed neutral, and assign a corresponding CSS class. This class name gets injected into the HTML using <%= colorClass %>.
The HTML Output: Finally, we build the actual HTML that will appear in the cell. Notice the part attributes—these are CSS parts that let you style the rendered content from outside the component. The colorClass variable makes each part dynamic: price-change-gain, price-change-loss, etc.
The result? One renderer class that handles all the edge cases, formats data intelligently, and generates styled HTML based on the actual values.
Using the Renderer in Your Table
Once you've built your renderer, using it is straightforward. When you add a column to your table, just call setRenderer():
Table<Cryptocurrency> table = new Table<>();

table.addColumn("24h Change", Cryptocurrency::getPriceChange24h)
    .setRenderer(new PriceChangeRenderer())
    .setSortable(true);
That's it - the column will now use your custom renderer for every cell in that column. The Cryptocurrency::getPriceChange24h part tells the column which value to use as the default cell value.
You can also add a renderer without a value provider if your renderer pulls all the data it needs itself:
table.addColumn("Price Change")
    .setRenderer(new PriceChangeRenderer());
The table handles the rest - your renderer gets called for each row, receives the current cell data, and returns the formatted HTML.
Built-in Renderers
While custom renderers give you complete control, webforJ includes several pre-built renderers for common use cases:
ButtonRenderer - Renders a webforJ button in a cell, complete with click events and theming:
table.addColumn("Actions", new ButtonRenderer<>("Delete", event -> {
    // Handle button click
}));
IconRenderer - Displays icons from webforJ's icon library:
table.addColumn("Status", new IconRenderer<>(TablerIcon.create("check")));
ElementRenderer and VoidElementRenderer - Base classes for creating renderers that wrap HTML elements. Use ElementRenderer for tags with content (like <div>) and VoidElementRenderer for those without content (like <img>).
These built-in options handle the most common scenarios, and you can extend them to add custom behavior. But when you need complete control over the rendering logic and HTML output—like we did with the price change formatter—building a custom renderer from scratch is the way to go.
See It in Action
Want to try this example yourself? The complete source code for the cryptocurrency dashboard is available on GitHub:
View the webforJ Dashboard project on GitHub
Clone it, run it, and see how renderers can transform your tables!
Learn More
- Table Rendering Documentation - Deep dive into renderers
- Table Component Overview - Working with tables
- Table Columns - Column configuration
The right rendering strategy can transform a plain data table into an engaging, informative user interface. Understanding renderers and when to use them will help you build more polished, professional webforJ applications.